

A population number can be official and still support the wrong claim. Census population estimates help us check reported growth, decline, and community size, but the number needs its place, date, and definition attached.
We start with a simple rule: match the claim to the data, then decide what the evidence supports. That means looking past the headline and into the table where the figure came from.
Start with the exact population claim
Before searching for a number, preserve the sentence you're checking. Keep the population figure, place name, time period, and source attribution together.
"Population grew last year" leaves several things unresolved. It doesn't identify the starting date. It doesn't say whether "population" means city residents or everyone in the surrounding metropolitan area. It may describe a percentage increase without giving the population used to calculate it.
We separate those pieces before deciding whether the claim holds:
- Record the exact number or percentage being reported.
- Identify the geographic area named in the claim.
- Note the date or period the figure supposedly describes.
- Identify who is included in the population.
- Trace the figure to the original Census product and release.
Our guidance on checking original data sources follows the same principle. A news article may point toward evidence, but repetition doesn't strengthen a number's foundation.
If the claim leaves out a date or definition, preserve that gap. Don't silently supply the detail that makes the sentence work.
Know what Census population estimates measure
The Census Bureau publishes several kinds of population information. Their shared source doesn't make them interchangeable.
Decennial counts describe a census date
The 2020 Census counted people according to where they lived on April 1, 2020. That count provides a fixed reference point.
A story published in 2026 can accurately quote the 2020 count. It becomes misleading when the wording presents that count as the community's current population.
The date belongs to the number, even when a headline leaves it behind. A census count also isn't free of coverage problems simply because its purpose is to count everyone.
Annual estimates and survey estimates answer different questions
The Population Estimates Program estimates population between decennial censuses. It starts with a census-based population base and accounts for subsequent change, including births, deaths, and migration.
The Bureau's population estimates methodology describes how those figures are produced. An annual estimate updates our picture of population without conducting another nationwide enumeration.
The American Community Survey, or ACS, is different again. Its survey estimates describe population and housing characteristics, including income, education, and employment.
An ACS one-year estimate covers a year. An ACS five-year estimate covers a five-year period. Neither should be read as a population snapshot for July 1.
We choose the product that answers the claim. A source can be reliable while measuring something other than what the sentence says.

Match the geography and reference date
Two numbers can describe the same general location while counting different areas. Two dates can appear in the same release while referring to different things.
Keep the geographic boundaries visible
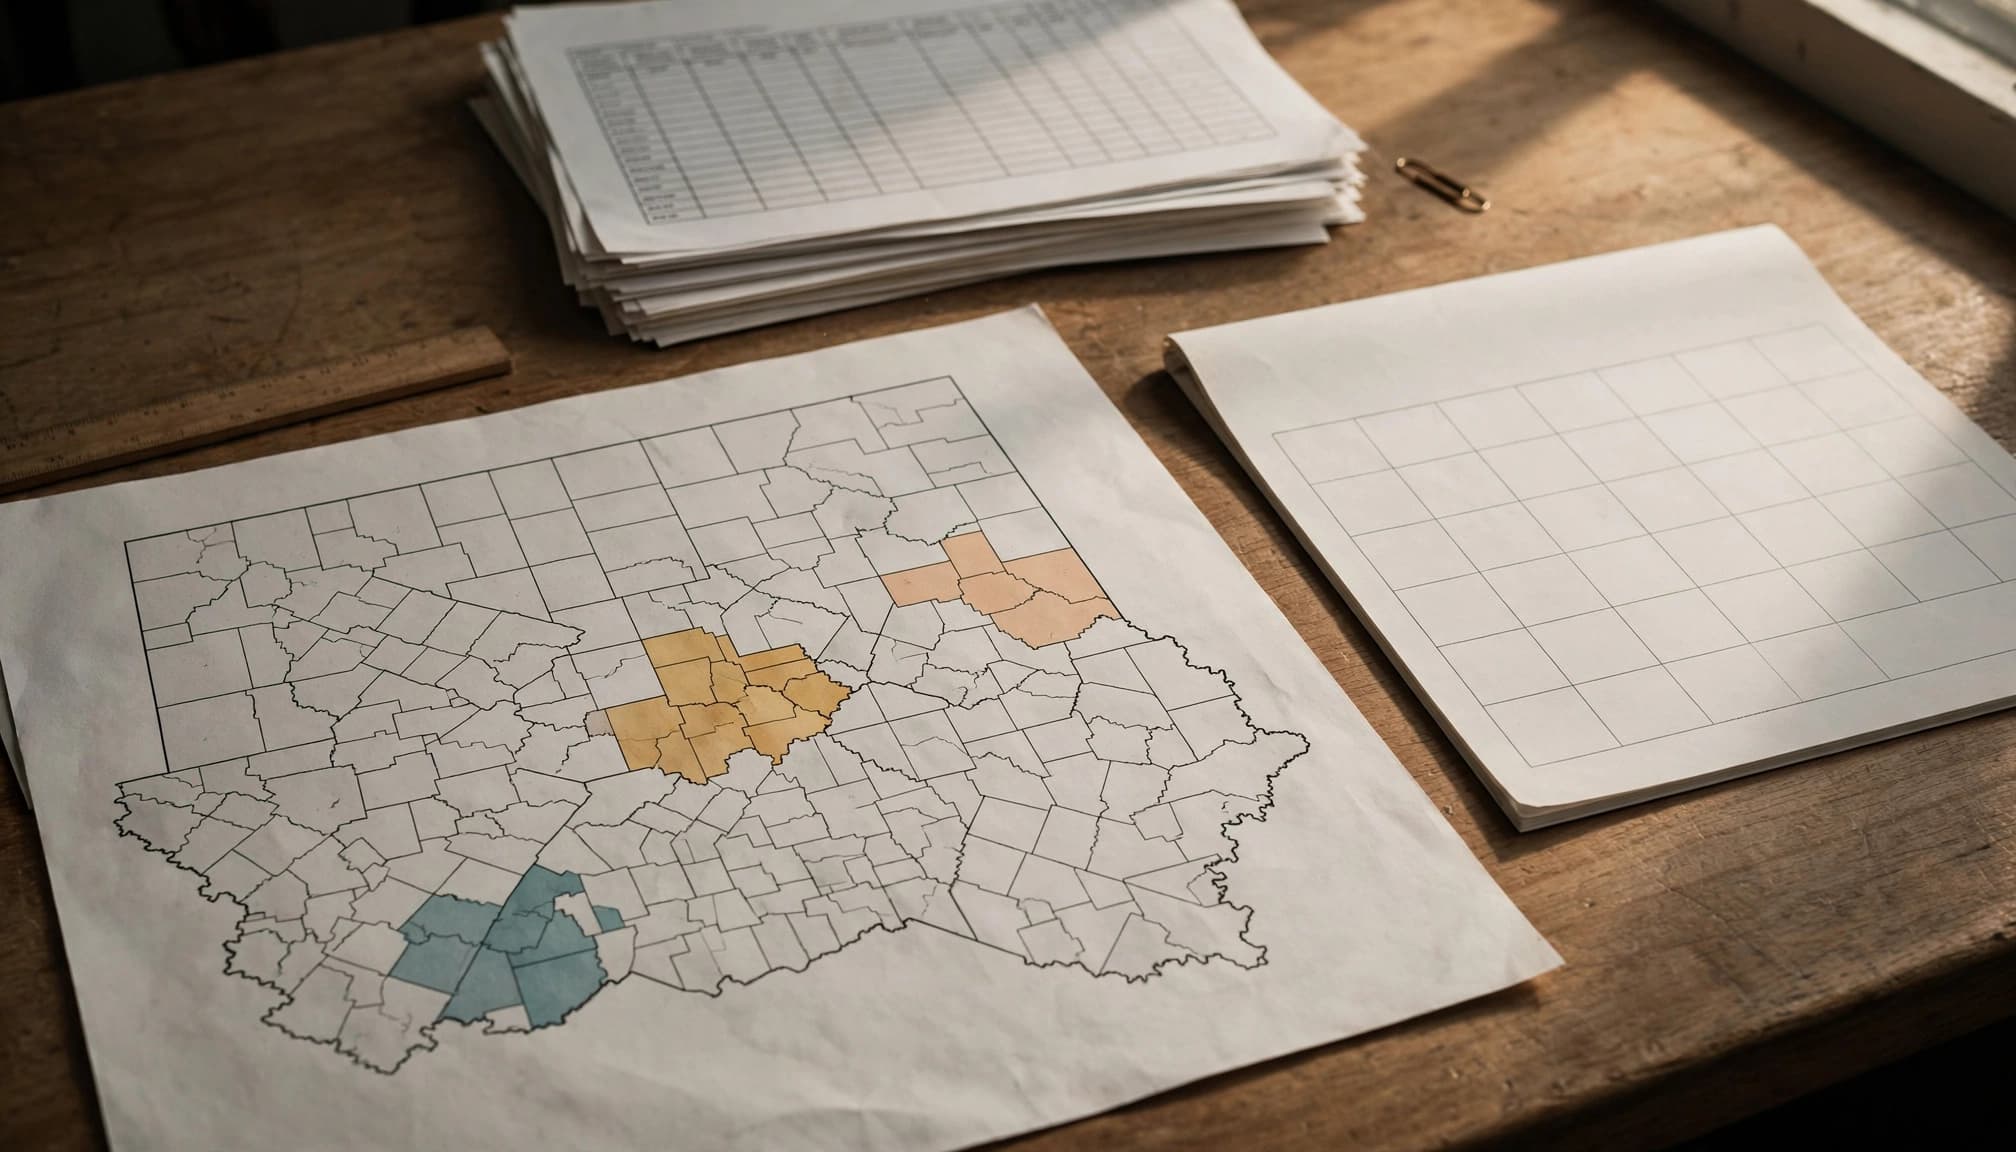
A city, county, and metropolitan area aren't interchangeable. A metropolitan area can include several counties and multiple municipalities. An incorporated place follows its municipal boundaries.
That matters when a report uses a familiar city name as shorthand for a larger region. The number may be accurate for the metropolitan area but wrong for the city itself.
Record the geographic label exactly as the table gives it. Keep the state name and geographic identifier when available. Similar names aren't enough to establish a match.
Boundary changes matter, too. Annexation can increase a city's reported population because the city covers more territory. A population change doesn't automatically mean the same area gained that many residents.
Separate the reference date from publication
The standard reference date for Census population estimates is July 1, unless the product says otherwise. The Bureau states this on its population estimates tables page.
The release date tells you when the information became public. The reference date tells you when the estimated population existed.
A release published in 2026 may describe July 1, 2025. Calling that a "2026 population" shifts the figure forward without evidence.
For a growth claim, identify both endpoints. April 1, 2020 and July 1, 2025 don't describe a five-year interval with matching calendar dates.
Match the people included in the figure
Population universe is the term for the people a statistic covers. We translate it into a plainer question: Who is included?
Total residents aren’t a substitute for every subgroup
A total resident population includes children as well as adults. It doesn't tell us how many people are registered voters, eligible voters, or members of a particular demographic group.
Those distinctions become important when population figures appear in stories about elections, public services, or representation. A total population figure may provide context without answering the narrower question.
Use a subgroup figure when the claim concerns a subgroup. Don't turn a total resident estimate into a count of adults or voters by changing the sentence around it.
Percentages need the right denominator
A population share depends on the total used beneath it. A group's share of all residents differs from its share of adults.
The same discipline applies to growth rates. Percentage growth uses the earlier population as the denominator. The raw increase tells us how many residents were added; the percentage tells us how large that increase was relative to the starting population.
We keep those measures separate. A larger numerical gain doesn't necessarily mean faster percentage growth.
Keep the data vintage attached
A vintage identifies an annual estimates series. Vintage 2025 ends with estimates for 2025, even though its releases appeared in 2026.
As of October 2026, Vintage 2025 is the latest complete series listed on the Bureau's population estimates release schedule. Its final scheduled release was June 25, 2026.
The vintage matters because new releases can revise estimates for earlier years. Updated records and methods can change the earlier figures as well as add a new year.
For year-to-year growth, take both figures from the same vintage. That keeps the comparison within one revised series.
A revised estimate for an earlier year changes the published record. It doesn't mean the population changed after that year's reference date.
We also distinguish two questions: Was a report faithful to the information available when published? What does the latest series now show?
An older article may accurately reflect its original release while differing from a later revision. State that difference instead of treating every changed figure as evidence of a reporting error.
Find the official file behind the summary
Census press releases provide useful summaries. The underlying tables provide the figures needed to reproduce a comparison.
For national and state resident totals, the Vintage 2025 table is NST-EST2025-POP. For incorporated places, the corresponding table is SUB-IP-EST2025-POP.
The Bureau's city and town estimates release identifies the incorporated-place series covering April 1, 2020 through July 1, 2025. Those totals were released May 14, 2026.
Read the column headings before copying a cell. A table may contain an April 1 estimates base alongside several July 1 estimates. Adjacent columns can look alike while describing different dates.
We keep a source record with the document title, table name, geography, column date, vintage, URL, and access date. Saving the downloaded file also preserves the version behind the finding.
That record gives a correction somewhere to start. A screenshot of one cell rarely preserves enough context.
Worked example: check a national growth claim
The Bureau's Vintage 2025 national and state release reports U.S. population growth of 0.5% between July 2024 and July 2025. It was published January 27, 2026.
To assess that statement, we first identify what it says. The geography is the United States. The measure is resident population growth. The endpoints are July 1, 2024 and July 1, 2025. The series is Vintage 2025.
The matching calculation uses the national row in NST-EST2025-POP. Subtract the July 2024 estimate from the July 2025 estimate. Divide that difference by the July 2024 estimate, then multiply by 100.
Use the full table values before rounding. Calculating from population totals already rounded to millions can produce a different displayed rate.
The supported conclusion is narrow: The Bureau estimated 0.5% national population growth over that July-to-July period.
The figure doesn't describe growth during calendar year 2026. It doesn't establish that every state grew. It doesn't show why the population changed.
A claim attributing the increase to migration requires the relevant components-of-change data. A total alone can't establish the cause.
This is where a sound number can acquire an unsupported explanation. We keep the arithmetic, time period, and interpretation separate.
Report the finding without false precision
An estimate printed to the nearest person is still an estimate. Its display precision doesn't turn it into an exact head count.
Use "estimated population" when that is what the source provides. Preserve qualifications that affect the conclusion, especially when reporting small differences or revised figures.
Survey comparisons need their own care. The Bureau's ACS comparison guidance says to compare one-year estimates with one-year estimates and five-year estimates with five-year estimates. A change in the measurement period can look like a population change.
When sources disagree, explain the difference you can establish. One may use an older vintage, another geography, or a different Census product.
Our discussion of context in viral fact checks applies here: a verdict can lose the conditions that made it valid.
A useful finding identifies whether the number matches, whether the comparison is compatible, and whether the wording goes beyond the evidence.
Keep the claim close to the evidence
Population verification depends on matching the place, date, people, and release behind a figure. Official data deserve careful reading, not automatic acceptance of every sentence built around them.
We preserve the source trail so a number stays connected to what it measures. A supported population claim is one another reader can trace and reproduce, with its limits still visible.