
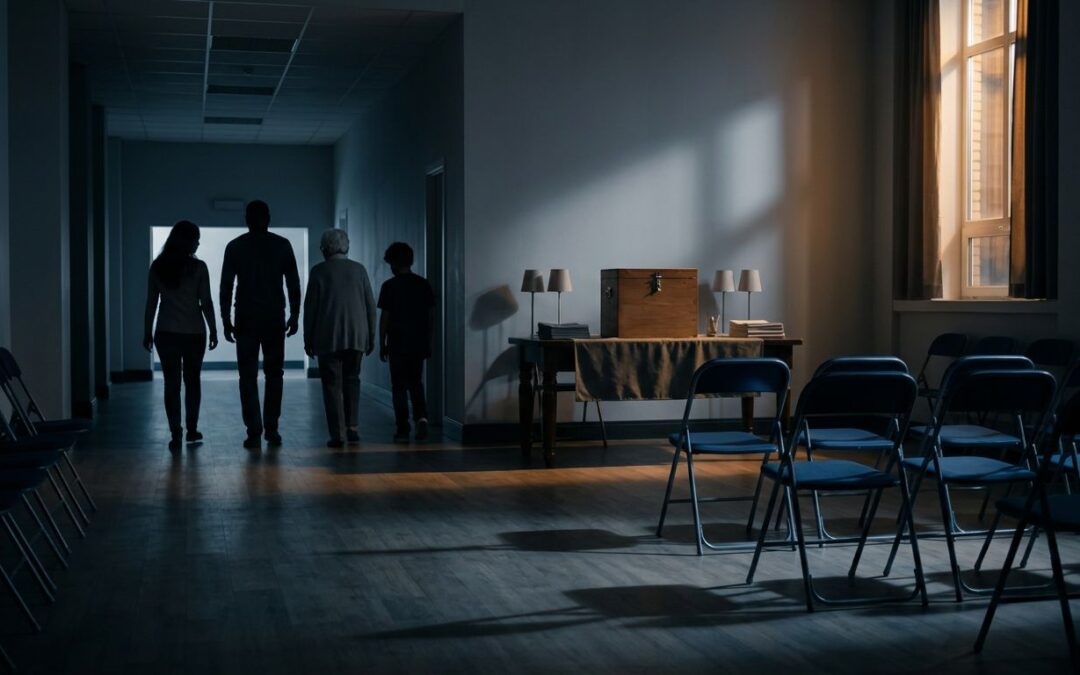
In 2024, the biggest voting bloc was not Democrats or Republicans. It was the people who stayed home.
Depending on the measure, about 64% to 65.3% of eligible Americans voted, which still leaves roughly 90 million eligible nonvoters. That group is not one mood, one class, or one age. The answer is a mix of choice, friction, and ordinary life.
We get a clearer picture once we stop treating nonvoting like a single behavior. The reasons split fast.
The headline number hides a mixed group
The 2024 election drew strong turnout by modern standards. Around 154 million to 155 million people voted, and the turnout rate was among the highest in decades. That sounds like a huge civic moment, and it was. It still left a giant pool of people who did not cast a ballot.
A simple way to think about it: some 2024 nonvoters had no interest in the contest, some were annoyed by the choices, and some ran into barriers that had nothing to do with ideology.
Here is the basic split that kept showing up across surveys and post-election reporting:
| Reason cited | What it usually means | Who mentioned it more |
|---|---|---|
| Not interested | Low attachment, low trust, or no pull from the race | Higher in the West, lower-income adults, Black adults |
| Too busy | Work, school, caregiving, or plain scheduling pressure | Common among ages 18 to 24 |
| Disliked candidates or issues | Neither side felt worth the trip | Common among younger adults |
| Illness or disability | Health made voting hard or impossible | More common among 65+ adults |
| Registration or admin trouble | Deadlines, paperwork, or confusion | Common among younger and financially strained voters |
The wording changes across surveys, so the exact percentages move around. The pattern does not.
A skipped ballot can mean protest, confusion, illness, or plain exhaustion.
That is why the label "nonvoter" is useful but incomplete. It tells us what happened. It does not tell us why.
Choice, not turnout: the voters who stayed home on purpose
Some people stayed home because they wanted to. That does not make their choice shallow. It just means we should not assume every nonvote came from a barrier.
In national survey work, "not interested" kept showing up as the top reason. Other people said they disliked the candidates or did not care enough about the issues. Those answers point to disengagement, disappointment, or a sense that the race was already settled.
Pew Research Center's turnout analysis found that 89% of Donald Trump's 2020 voters turned out again in 2024, compared with 85% of Joe Biden's 2020 voters. That gap is not huge, but it matters. Prior voting history is one of the best predictors of future voting.
The habit effect is easy to miss. If someone voted in the last presidential race, they are more likely to vote again. If someone sat out the last one, they are more likely to sit out again. Civic behavior tends to echo.
That does not mean partisan loyalty explains everything. It means attention, habit, and comfort with the process matter more than we often admit. Some people see an election as an obligation. Others see it as a burden with no payoff.
State-level turnout also varied a lot. Ballotpedia's 2024 turnout analysis shows how much the map changes once we look beyond the national average.
We should keep one point clear. "Not interested" is a real answer. So is "I thought neither side spoke to me." Those are voluntary forms of nonparticipation, and they are not the same as being blocked by work, illness, or deadlines.
Younger adults ran into friction, not just apathy
Youth turnout was lower than the national average again. Tufts' barriers and hardships report found that 47% of Americans ages 18 to 29 voted in 2024, down from 50% in 2020. That is not collapse, but it is not a small thing either.
Younger nonvoters often described a messy mix of reasons. They were busy. They were out of town. They missed deadlines. They were not sure how to register or how to vote absentee. Some were facing financial strain, childcare problems, or work schedules that left little room for election day logistics.
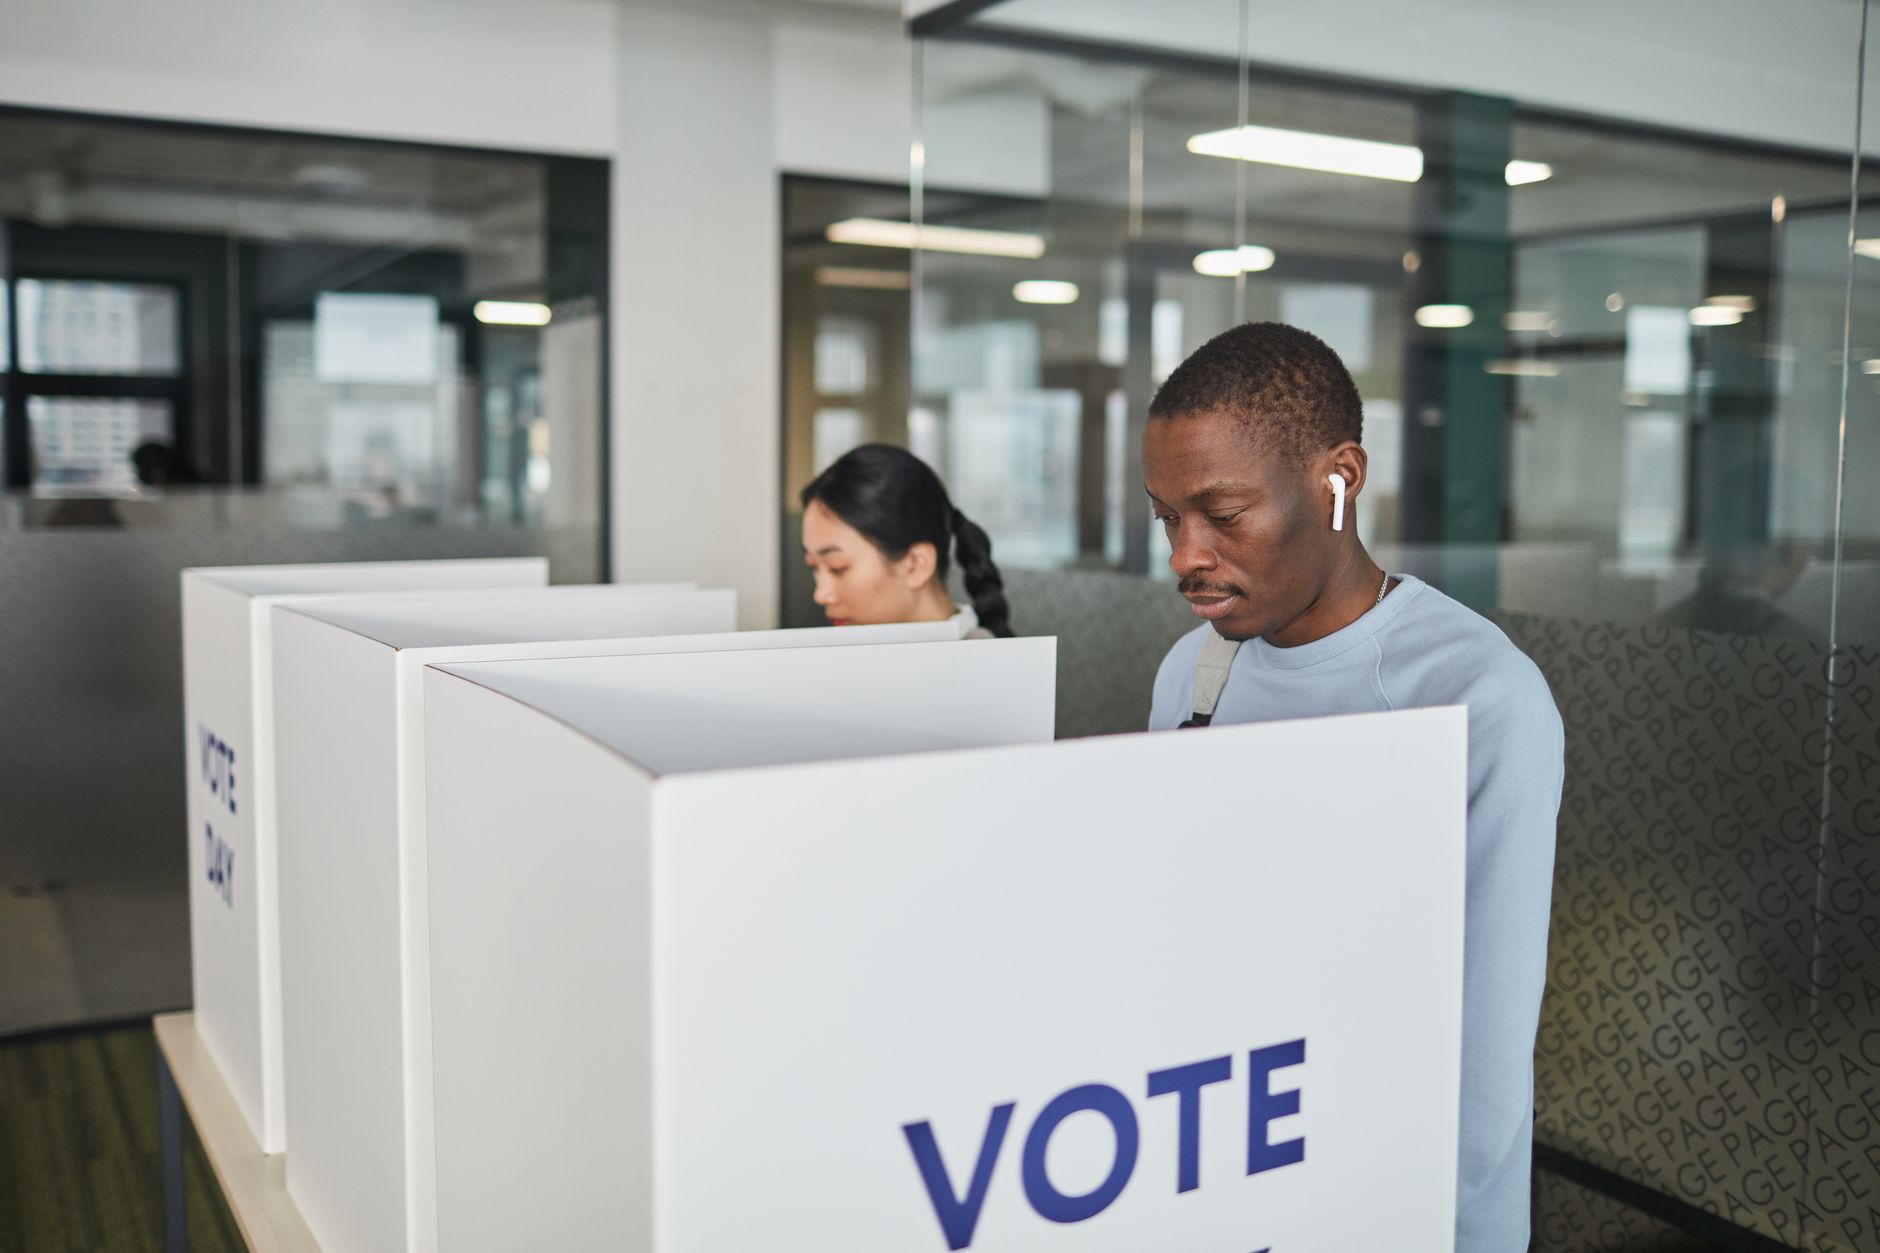
Photo by Edmond Dantès
That report also found a class angle inside the youth vote. Among young people who missed registration deadlines, 29% said they struggled to meet basic financial needs, compared with 14% overall. Youth of color were also more likely than white youth to say they lacked enough information.
That matters because "apathy" is too lazy a word for what is often happening. A person can care about politics and still miss a deadline. A person can dislike both candidates and still want to vote. A person can be motivated and still lose to a bad schedule.
The barrier side is laid out in barriers to voting in the 2024 election, and the main point is simple. Friction is not random. It hits harder when money is tight, time is scarce, and election rules are confusing.
The 2024 youth story was not "young people do not care." It was closer to "young people care unevenly, and the system asks them to make the vote fit the rest of their life." That is a different story.
Income, education, race, and health shaped the outcome
Nonvoting did not fall evenly across the population. It clustered where life was already harder.
PRRI's post-election survey found that nonvoters were more likely than voters to have lower incomes and less education. In the data, 48% of nonvoters had a high school education or less, while college graduates made up a much larger share of voters than nonvoters. That is not a moral judgment. It is a turnout pattern.
Income shows the same shape. People with less money often face more unstable work schedules, more child-care pressure, more transportation problems, and more administrative friction. Voting is easier when life is predictable. It is harder when every hour is already spoken for.
Race and geography also mattered, but not in one neat way. Census-based data showed higher turnout among white non-Hispanic adults than among Black and Hispanic adults. At the same time, the reasons for not voting differed inside those groups. The West had a bigger share of people saying they were "not interested," while lower-income adults were more likely to give the same answer. Different paths can end in the same ballot box absence.
Older adults were different again. Turnout was highest among people 65 and older, but illness was the top reason for not voting in that group. That is the clearest reminder that nonvoting is not always a choice. Sometimes it is physical reality.
So when we ask why 2024 nonvoters skipped the election, we have to hold two ideas at once. Some people opted out. Some people were pushed out. Many were a little of both.
Conclusion
The 2024 nonvoters were not one bloc, and the data never said they were. Some were disengaged, some were disappointed, and some were stopped by deadlines, health, work, or family pressure.
That is the part worth keeping in view. When we flatten nonvoting into laziness, we miss the barrier side. When we flatten it into system failure, we miss the people who simply did not care enough to show up. The truth is usually a blend of both.
If we want to understand turnout better next time, we have to ask one more question after "Who stayed home?" We have to ask, "Which kind of staying home was it?"